A linear equation in two variables is any equation that has next view: a*x + b*y =с. Here x and y are two variables, a,b,c are some numbers.
By decision linear equation a*x + b*y = c is any pair of numbers (x,y) that satisfies this equation, that is, turns the equation with variables x and y into a correct numerical equality. A linear equation has infinite set decisions.
If each pair of numbers that are solutions to a linear equation in two variables is depicted on the coordinate plane as points, then all these points form the graph of a linear equation in two variables. The coordinates of the points will be our x and y values. In this case, the x value will be the abscissa, and the y value will be the ordinate.
Graph of a Linear Equation in Two Variables
The graph of a linear equation with two variables is the set of all possible points on the coordinate plane, the coordinates of which will be solutions to this linear equation. It is easy to guess that the graph will be a straight line. That is why such equations are called linear.
Construction algorithm
Algorithm for plotting a linear equation in two variables.
1. Draw coordinate axes, label them and mark the unit scale.
2. In a linear equation, put x = 0, and solve the resulting equation for y. Mark the resulting point on the graph.
3. In a linear equation, take the number 0 as y, and solve the resulting equation for x. Mark the resulting point on the graph
4. If necessary, take an arbitrary value of x and solve the resulting equation for y. Mark the resulting point on the graph.
5. Connect the resulting points and continue the graph beyond them. Sign the resulting straight line.
Example: Graph the equation 3*x - 2*y =6;
Let's put x=0, then - 2*y =6; y= -3;
Let's put y=0, then 3*x = 6; x=2;
We mark the obtained points on the graph, draw a straight line through them and label it. Look at the figure below, the graph should look exactly like this.
OBJECTIVE:1) To introduce students to the concept of “equation with two variables”;
2) Learn to determine the degree of an equation with two variables;
3) Teach to identify by given function which figure is a graph
4) Consider transformations of graphs with two variables;
given equation with two variables using the Agrapher program;
6) Develop logical thinking students.
I. New material - an explanatory lecture with elements of conversation.
(the lecture is conducted using the author’s slides; graphs are drawn in the Agrapher program)
T: When studying lines, two problems arise:
Using the geometric properties of a given line, find its equation;
Inverse problem: given the equation of a line, study its geometric properties.
We considered the first problem in the geometry course in relation to circles and straight lines.
Today we will consider the inverse problem.
Consider equations of the form:
A) x(x-y)=4; b) 2u-x 2 =-2 ; V) x(x+y 2 ) = x +1.
are examples of equations with two variables.
Equations with two variables X And at looks like f(x,y)=(x,y), Where f And – expressions with variables X And u.
If in Eq. x(x-y)=4 substitute in place of variable X its value is -1, and instead at– value 3, then the correct equality will be obtained: 1*(-1-3)=4,
Pair (-1; 3) variable values X And at is a solution to the equation x(x-y)=4.
That is solving the equation with two variables is called the set of ordered pairs of values of variables that form this equation into a true equality.
Equations with two variables usually have infinitely many solutions. Exceptions form, for example, equations such as X 2 +(y 2 - 4) 2 = 0 or
2x 2 + at 2 = 0 .
The first of them has two solutions (0; -2) and (0; 2), the second has one solution (0; 0).
The equation x 4 + y 4 +3 = 0 has no solutions at all. It is of interest when the values of the variables in the equation are integers. By solving such equations with two variables, pairs of integers are found. In such cases, the equation is said to be solved in integers.
Two equations having the same set of solutions are called equivalent equations. For example, the equation x(x + y 2) = x + 1 is an equation of the third degree, since it can be transformed into the equation xy 2 + x 2 - x-1 = 0, the right side of which is a polynomial of the standard form of the third degree.
The degree of an equation with two variables, represented in the form F(x, y) = 0, where F(x, y) is a polynomial of standard form, is called the degree of the polynomial F(x, y).
If all solutions to an equation with two variables are depicted as points in the coordinate plane, you will get a graph of an equation with two variables.
Schedule equation with two variables is the set of points whose coordinates serve as solutions to this equation.
So, the graph of the equation ax + by + c = 0 is a straight line if at least one of the coefficients a or b not equal to zero (Fig. 1). If a = b = c = 0, then the graph of this equation is coordinate plane (Fig. 2), if a = b = 0, A c0, then the graph is empty set (Fig. 3).
Equation graph y = a x 2 + by + c is a parabola (Fig. 4), a graph of the equation xy=k (k0) – hyperbole (Fig. 5). Equation graph X 2 + y 2 = r, where x and y are variables, r is a positive number, is circle with center at the origin and radius equal to r(Fig. 6). The graph of the equation is ellipse, Where a And b– major and minor semi-axes of the ellipse (Fig. 7).
The construction of graphs of some equations is facilitated by the use of their transformations. Let's consider converting graphs of equations in two variables and formulate the rules by which the simplest transformations of equation graphs are performed
1) The graph of the equation F (-x, y) = 0 is obtained from the graph of the equation F (x, y) = 0 using symmetry about the axis u.
2) The graph of the equation F (x, -y) = 0 is obtained from the graph of the equation F (x, y) = 0 using symmetry about the axis X.
3) The graph of the equation F (-x, -y) = 0 is obtained from the graph of the equation F (x, y) = 0 using central symmetry about the origin.
4) The graph of the equation F (x-a, y) = 0 is obtained from the graph of the equation F (x, y) = 0 by moving parallel to the x-axis by |a| units (to the right, if a> 0, and to the left if A < 0).
5) The graph of the equation F (x, y-b) = 0 is obtained from the graph of the equation F (x, y) = 0 by moving to |b| units parallel to the axis at(up if b> 0, and down if b < 0).
6) The graph of the equation F (ax, y) = 0 is obtained from the graph of the equation F (x, y) = 0 by compressing to the y-axis and a times, if A> 1, and by stretching from the y-axis by times, if 0< A < 1.
7) The graph of the equation F (x, by) = 0 is obtained from the graph of the equation F (x, y) = 0 using compression to the x-axis in b times if b> 1, and by stretching from the x axis by times if 0 < b < 1.
If the graph of some equation is rotated by a certain angle near the origin, then the new graph will be the graph of another equation. The special cases of rotation at angles of 90 0 and 45 0 are important.
8) The graph of the equation F (x, y) = 0 as a result of a clockwise rotation near the origin of coordinates by an angle of 90 0 turns into the graph of the equation F (-y, x) = 0, and counterclockwise into the graph of the equation F (y , -x) = 0.
9) The graph of the equation F (x, y) = 0 as a result of a clockwise rotation near the origin of coordinates by an angle of 45 0 turns into the graph of the equation F = 0, and counterclockwise into the graph of the equation F ![]() = 0.
= 0.
From the rules we have considered for transforming graphs of equations with two variables, rules for transforming graphs of functions are easily obtained.
Example 1. Let us show that by graphing the equation X 2 + y 2 + 2x – 8y + 8 = 0 is a circle (Fig. 17).
Let's transform the equation as follows:
1) group the terms containing the variable X and containing a variable at, and imagine each group of terms in the form of a complete square trinomial: (x 2 + 2x + 1) + (y 2 -2*4*y + 16) + 8 – 1 – 16 = 0;
2) write the resulting trinomials as the square of the sum (difference) of two expressions: (x + 1) 2 + (y – 4) 2 - 9 = 0;
3) let’s analyze, according to the rules for transforming graphs of equations with two variables, the equation (x + 1) 2 + (y – 4) 2 = 3 2: the graph of this equation is a circle with a center at the point (-1; 4) and a radius of 3 units .
Example 2: Let's graph the equation X 2 + 4у 2 = 9 .
Let's imagine 4y 2 in the form (2y) 2, we get the equation x 2 + (2y) 2 = 9, the graph of which can be obtained from the circle x 2 + y 2 = 9 by compressing the x axis by a factor of 2.
Draw a circle with a center at the origin and a radius of 3 units.
Let's reduce the distance of each point from the X axis by 2 times and get a graph of the equation
x 2 + (2y) 2 = 9.
We obtained the figure by compressing the circle to one of its diameters (to the diameter that lies on the X axis). This figure is called an ellipse (Fig. 18).
Example 3. Let's find out what the graph of the equation x 2 - y 2 = 8 is.
Let's use the formula F= 0.
Substituting in this equation instead of X and instead of Y, we get:

T: What is the graph of the equation y = ?
D: The graph of the equation y = is a hyperbola.
U: We transformed the equation of the form x 2 - y 2 = 8 into the equation y =.
Which line will be the graph of this equation?
D: So, the graph of the equation x 2 - y 2 = 8 is a hyperbola.
U: Which lines are asymptotes of the hyperbola y = .
D: The asymptotes of the hyperbola y = are the straight lines y = 0 and x = 0.
U: When the rotation is completed, these straight lines will turn into straight lines = 0 and = 0, that is, into straight lines y = x and y = - x. (Fig. 19).
Example 4: Let's find out what form the equation y = x 2 of the parabola will take when rotated around the origin by an angle of 90 0 clockwise.
Using the formula F (-y; x) = 0, in the equation y = x 2 we replace the variable x with – y, and the variable y with x. We obtain the equation x = (-y) 2, i.e. x = y 2 (Fig. 20).
We looked at examples of graphs of second-degree equations with two variables and found out that the graphs of such equations can be a parabola, a hyperbola, an ellipse (in particular, a circle). In addition, the graph of an equation of the second degree can be a pair of lines (intersecting or parallel). This is the so-called degenerate case. So the graph of the equation x 2 - y 2 = 0 is a pair of intersecting lines (Fig. 21a), and the graph of the equation x 2 - 5x + 6 + 0y = 0 is parallel lines.
II Consolidation.
(students are given “Instruction cards” for constructing graphs of equations with two variables in the Agrapher program (Appendix 2) and “Practical task” cards (Appendix 3) with the formulation of tasks 1-8. The teacher demonstrates graphs of equations for tasks 4-5 on slides ).
Exercise 1. Which of the pairs (5;4), (1;0), (-5;-4) and (-1; -) are solutions to the equation:
a) x 2 - y 2 = 0, b) x 3 - 1 = x 2 y + 6y?
Solution:
Substituting the coordinates of these points into the given equation, we are convinced that not a single given pair is a solution to the equation x 2 - y 2 = 0, and the solutions to the equation x 3 - 1 = x 2 y + 6y are the pairs (5;4), ( 1;0) and (-1; -).
125 - 1 = 100 + 24 (I)
1 - 1= 0 + 0 (I)
125 – 1 = -100 – 24 (L)
1 – 1 = - - (I)
Answer: A); b) (5;4), (1; 0), (-1; -).
Task 2. Find solutions to the equation xy 2 - x 2 y = 12 in which the value X equals 3.
Solution: 1) Substitute the value 3 instead of X in the given equation.
2) We get quadratic equation relative to the variable Y, having the form:
3y 2 - 9y = 12.
4) Let's solve this equation:
3y 2 - 9y – 12 = 0
D = 81 + 144 = 225
![]()
Answer: pairs (3;4) and (3;-1) are solutions to the equation xy 2 - x 2 y = 12
Task 3. Determine the degree of the equation:
a) 2y 2 - 3x 3 + 4x = 2; c) (3 x 2 + x)(4x - y 2) = x;
b) 5y 2 - 3y 2 x 2 + 2x 3 = 0; d) (2y - x 2) 2 = x(x 2 + 4xy + 1).
Answer: a) 3; b) 5; at 4; d) 4.
Task 4. Which figure is the graph of the equation:
a) 2x = 5 + 3y; b) 6 x 2 - 5x = y – 1; c) 2(x + 1) = x 2 - y;
d) (x - 1.5)(x – 4) = 0; e) xy – 1.2 = 0; e) x 2 + y 2 = 9.
Task 5. Write an equation whose graph is symmetrical to the graph of the equation x 2 - xy + 3 = 0 (Fig. 24) with respect to: a) axis X; b) axes at; c) straight line y = x; d) straight line y = -x.
Task6. Make up an equation, the graph of which is obtained by stretching the graph of the equation y = x 2 -3 (Fig. 25):
a) from the x axis 2 times; b) from the y-axis 3 times.
Check with the Agrapher program that the task was completed correctly.
Answer: a)y - x 2 + 3 = 0 (Fig. 25a); b) y-(x) 2 + 3 = 0 (Fig. 25b).
b) the lines are parallel, moving parallel to the x-axis 1 unit to the right and parallel to the y-axis 3 units down (Fig. 26b);
c) straight lines intersect, symmetrical display relative to the x axis (Fig. 26c);
d) straight lines intersect, symmetrical display relative to the y-axis (Fig. 26d);
e) the lines are parallel, symmetrical display relative to the origin (Fig. 26e);
e) straight lines intersect, rotation around the origin by 90 clockwise and symmetrical display relative to the x axis (Fig. 26e).
III. Independent educational work.
(students are given cards “Independent work” and a “Reporting table of the results of independent work”, in which students write down their answers and, after self-testing, evaluate the work according to the proposed scheme) Appendix 4 ..
I. option.
a) 5x 3 -3x 2 y 2 + 8 = 0; b) (x + y + 1) 2 - (x-y) 2 = 2(x + y).
a) x 3 + y 3 -5x 2 = 0; b) x 4 +4x 3 y +6x 2 y 2 + 4xy 3 + y 4 = 1.
x 4 + y 4 -8x 2 + 16 = 0.
a) (x + 1) 2 + (y-1) 2 = 4;
b) x 2 -y 2 = 1;
c) x - y 2 = 9.
x 2 - 2x + y 2 - 4y = 20.
Specify the coordinates of the circle's center and its radius.
6. How should the hyperbola y = be moved on the coordinate plane so that its equation takes the form x 2 - y 2 = 16?
Check your answer by graphing using Agrapher.
7. How should the parabola y = x 2 be moved on the coordinate plane so that its equation takes the form x = y 2 - 1
Option II.
1. Determine the degree of the equation:
a)3xy = (y-x 3)(x 2 +y); b) 2y 3 + 5x 2 y 2 - 7 = 0.
2. Is the pair of numbers (-2;3) a solution to the equation:
a) x 2 -y 2 -3x = 1; b) 8x 3 + 12x 2 y + 6xy 2 + y 3 = -1.
3. Find the set of solutions to the equation:
x 2 + y 2 -2x – 8y + 17 = 0.
4. What kind of curve (hyperbola, circle, parabola) is a set of points if the equation of this curve has the form:
a) (x-2) 2 + (y + 2) 2 =9
b) y 2 - x 2 =1
c) x = y 2 - 1.
(check with the Agrapher program that the task was completed correctly)
5. Using the Agrapher program, plot the equation:
x 2 + y 2 - 6x + 10y = 2.
6. How should the hyperbola y = be moved on the coordinate plane so that its equation takes the form x 2 - y 2 = 28?
7. How should the parabola y = x 2 be moved on the coordinate plane so that its equation takes the form x = y 2 + 9.
Let it be given equation with two variables F(x; y). You have already become familiar with ways to solve such equations analytically. Many solutions of such equations can be represented in graph form.
The graph of the equation F(x; y) is the set of points on the coordinate plane xOy whose coordinates satisfy the equation.
To graph equations in two variables, first express the y variable in the equation in terms of the x variable.
Surely you already know how to build various graphs of equations with two variables: ax + b = c – straight line, yx = k – hyperbola, (x – a) 2 + (y – b) 2 = R 2 – circle whose radius is equal to R, and the center is at point O(a; b).
Example 1.
Graph the equation x 2 – 9y 2 = 0.
Solution.
Let's factorize left side equations
(x – 3y)(x+ 3y) = 0, that is, y = x/3 or y = -x/3.
Answer: Figure 1.
A special place is occupied by the definition of figures on the plane by equations containing the sign absolute value, which we will discuss in detail. Let's consider the stages of constructing graphs of equations of the form |y| = f(x) and |y| = |f(x)|.
The first equation is equivalent to the system
(f(x) ≥ 0,
(y = f(x) or y = -f(x).
That is, its graph consists of graphs of two functions: y = f(x) and y = -f(x), where f(x) ≥ 0.
To plot the second equation, plot two functions: y = f(x) and y = -f(x).
Example 2.
Graph the equation |y| = 2 + x.
Solution.
The given equation is equivalent to the system
(x + 2 ≥ 0,
(y = x + 2 or y = -x – 2.
We build many points.
Answer: Figure 2.
Example 3.
Plot the equation |y – x| = 1.
Solution.
If y ≥ x, then y = x + 1, if y ≤ x, then y = x – 1.
Answer: Figure 3.
When constructing graphs of equations containing a variable under the modulus sign, it is convenient and rational to use area method, based on dividing the coordinate plane into parts in which each submodular expression retains its sign.
Example 4.
Graph the equation x + |x| + y + |y| = 2.
Solution.
IN in this example the sign of each submodular expression depends on the coordinate quadrant.
1) In the first coordinate quarter x ≥ 0 and y ≥ 0. After expanding the module, the given equation will look like:
2x + 2y = 2, and after simplification x + y = 1.
2) In the second quarter, where x< 0, а y ≥ 0, уравнение будет иметь вид: 0 + 2y = 2 или y = 1.
3) In the third quarter x< 0, y < 0 будем иметь: x – x + y – y = 2. Перепишем этот результат в виде уравнения 0 · x + 0 · y = 2.
4) In the fourth quarter, when x ≥ 0, and y< 0 получим, что x = 1.
We will plot this equation by quarters.
Answer: Figure 4.
Example 5.
Draw a set of points whose coordinates satisfy the equality |x – 1| + |y – 1| = 1.
Solution.
The zeros of the submodular expressions x = 1 and y = 1 divide the coordinate plane into four regions. Let's break down the modules by region. Let's arrange this in the form of a table.
| Region |
Submodular expression sign |
The resulting equation after expanding the module |
| I | x ≥ 1 and y ≥ 1 | x + y = 3 |
| II | x< 1 и y ≥ 1 | -x + y = 1 |
| III | x< 1 и y < 1 | x + y = 1 |
| IV | x ≥ 1 and y< 1 | x – y = 1 |
Answer: Figure 5.
On the coordinate plane, figures can be specified and inequalities.
Inequality graph with two variables is the set of all points of the coordinate plane whose coordinates are solutions to this inequality.
Let's consider algorithm for constructing a model for solving inequalities with two variables:
- Write down the equation corresponding to the inequality.
- Graph the equation from step 1.
- Select an arbitrary point in one of the half-planes. Check whether the coordinates of the selected point satisfy this inequality.
- Draw graphically the set of all solutions to the inequality.
Let us first consider the inequality ax + bx + c > 0. The equation ax + bx + c = 0 defines a straight line dividing the plane into two half-planes. In each of them, the function f(x) = ax + bx + c retains its sign. To determine this sign, it is enough to take any point belonging to the half-plane and calculate the value of the function at this point. If the sign of the function coincides with the sign of the inequality, then this half-plane will be the solution to the inequality.
Let's look at examples graphic solution the most common inequalities with two variables.
1) ax + bx + c ≥ 0. Figure 6.
2)
|x| ≤ a, a > 0. Figure 7.
3) x 2 + y 2 ≤ a, a > 0. Figure 8.
4) y ≥ x 2 . Figure 9.
5)
xy ≤ 1. Figure 10. 
If you have questions or want to practice drawing on a plane model the sets of all solutions to inequalities in two variables using mathematical modeling, you can conduct free 25-minute lesson with an online tutor after you register. To continue working with a teacher, you will have the opportunity to choose a tariff plan that suits you.
Still have questions? Don't know how to draw a figure on a coordinate plane?
To get help from a tutor, register.
The first lesson is free!
website, when copying material in full or in part, a link to the source is required.
A rectangular coordinate system is a pair of perpendicular coordinate lines, called coordinate axes, that are placed so that they intersect at their origin.
Designation coordinate axes The letters x and y are generally accepted, but the letters can be any. If the letters x and y are used, then the plane is called xy-plane. Different applications may use letters other than x and y, and as shown in the figures below, there are uv plane And ts-plane.

Ordered pair
By ordered pair of real numbers, we mean two real numbers in a certain order. Each point P in the coordinate plane can be associated with a unique ordered pair of real numbers by drawing two lines through P: one perpendicular to the x-axis and the other perpendicular to the y-axis.
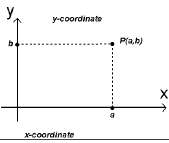
For example, if we take (a,b)=(4,3), then on the coordinate strip

To construct a point P(a,b) means to determine a point with coordinates (a,b) on the coordinate plane. For example, various points are plotted in the figure below.

In a rectangular coordinate system, the coordinate axes divide the plane into four regions called quadrants. They are numbered counterclockwise with Roman numerals, as shown in the figure.

Definition of a graph
Schedule equation with two variables x and y, is the set of points on the xy-plane whose coordinates are members of the set of solutions to this equation
Example: draw a graph of y = x 2
Because 1/x is undefined when x=0, we can only plot points for which x ≠0

Example: Find all intersections with axes
(a) 3x + 2y = 6
(b) x = y 2 -2y
(c) y = 1/x
Let y = 0, then 3x = 6 or x = 2
is the desired x-intercept.
Having established that x=0, we find that the point of intersection of the y-axis is the point y=3.
This way you can solve equation (b) and the solution for (c) is given below
x-intercept
Let y = 0
1/x = 0 => x cannot be determined, i.e. there is no intersection with the y-axis
Let x = 0
y = 1/0 => y is also undefined, => no intersection with the y axis
In the figure below, the points (x,y), (-x,y), (x,-y) and (-x,-y) represent the corners of the rectangle.

A graph is symmetrical about the x-axis if for every point (x,y) on the graph, point (x,-y) is also a point on the graph.
A graph is symmetrical about the y-axis if for every point on the graph (x,y), point (-x,y) also belongs to the graph.
A graph is symmetrical about the center of coordinates if for each point (x,y) on the graph, point (-x,-y) also belongs to this graph.


Definition:
Schedule functions on the coordinate plane is defined as the graph of the equation y = f(x)
Plot f(x) = x + 2

Example 2. Plot a graph of f(x) = |x|
The graph coincides with the line y = x for x > 0 and with line y = -x
for x< 0 .


graph of f(x) = -x
Combining these two graphs we get

graph f(x) = |x|
Example 3: Plot a graph
t(x) = (x 2 - 4)/(x - 2) =
= ((x - 2)(x + 2)/(x - 2)) =
= (x + 2) x ≠ 2
Therefore, this function can be written as
y = x + 2 x ≠ 2

Graph h(x)= x 2 - 4 Or x - 2
graph y = x + 2 x ≠ 2
Example 4: Plot a graph

Graphs of functions with displacement
Suppose that the graph of the function f(x) is known
Then we can find the graphs
y = f(x) + c - graph of function f(x), moved
UP c values
y = f(x) - c - graph of function f(x), moved
DOWN by c values
y = f(x + c) - graph of function f(x), moved
LEFT by c values
y = f(x - c) - graph of the function f(x), moved
Right by c values
Example 5: Build
graph y = f(x) = |x - 3| + 2
Let's move the graph y = |x| 3 values to the RIGHT to get the graph
Let's move the graph y = |x - 3| UP 2 values to get the graph y = |x - 3| + 2

Plot a graph
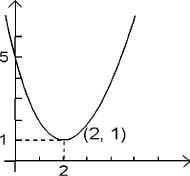
y = x 2 - 4x + 5
Let's transform the given equation as follows, adding 4 to both sides:
y + 4 = (x 2 - 4x + 5) + 4 y = (x 2 - 4x + 4) + 5 - 4
y = (x - 2) 2 + 1
Here we see that this graph can be obtained by moving the graph of y = x 2 to the right by 2 values, because x - 2, and up by 1 value, because +1.
y = x 2 - 4x + 5
Reflections
(-x, y) is a reflection of (x, y) about the y-axis
(x, -y) is a reflection of (x, y) about the x axis
The graphs y = f(x) and y = f(-x) are reflections of each other relative to the y axis
The graphs y = f(x) and y = -f(x) are reflections of each other relative to the x-axis
The graph can be obtained by reflecting and moving:
Draw a graph
Let's find its reflection relative to the y-axis and get a graph
Let's move this graph right by 2 values and we get a graph
Here is the graph you are looking for

If f(x) is multiplied by a positive constant c, then
the graph f(x) is compressed vertically if 0< c < 1
the graph f(x) is stretched vertically if c > 1

The curve is not a graph of y = f(x) for any function f