In a market economy, the stability of a company's position is largely due to its activity in work, which depends on the efficient use of resources, the breadth of markets, and economic sustainability.
In the financial aspect, the company’s activity is manifested by the speed of turnover of its funds, which can be analyzed by the turnover ratio working capital and other indicators.
The importance of indicators characterizing the turnover of funds is explained by the fact that they show the profitability of the company.
The coefficient (resource productivity) allows you to see the turnover rate of the entire capital of the company in the aggregate. It shows how many times the full cycle of circulation and production is carried out during the period under review or how many monetary units each unit produced.
The turnover ratio is calculated by dividing the net proceeds received from sales by the annual average. This indicator allows you to assess the efficiency of using assets, regardless of the sources of their formation. Determining the resource efficiency indicator shows the amount of profit received from each ruble invested in assets.
The financial condition of the company, its liquidity and solvency depend on the speed of turnover. The most important indicators of resource productivity are the period and speed of turnover. The latter shows how many capital turnover occurred over a certain period of time. The average period for which the return on investment in commercial operations will occur is called the turnover period.
Low turnover (of goods, for example) indicates the low efficiency of the company's assets.
Working capital turnover ratio
A characteristic of the speed of turnover from the moment of payment until the return of money for sold material assets to the bank account is the turnover of funds (current). Their amount is calculated based on their total size, subtracting the balance of monetary assets in the current account.
The working capital turnover ratio is also calculated by the ratio of (revenue) from the sale of goods to the amount of the company's working capital. The calculation does not take into account VAT and excise duty. If this indicator decreases, we can say that turnover is slowing down.
If turnover accelerates with a constant sales volume, then the company will have to use less working capital. With an increase in turnover, the company spends less reverse funds, which allows it to use material and monetary resources more efficiently. Working capital released from production can be used in other industries. Thus, the working capital turnover ratio shows the entire set of processes in the company’s activities: a decrease in capital intensity, an increase in the rate of productivity growth.
The main factors influencing the turnover of current assets are a reduction in the duration of the general technological cycle, improvement in sales and supply conditions, improvement in the organization of production and technology, and clear organization of settlement payment relations.
Accounts receivable turnover ratio
In the process of operation, enterprises have to provide commodity loans to consumers, as a result, receivables accumulate. Its turnover rate determines the number of turnovers per year of funds invested in the calculations.
If there is a product, then this is certainly good, but only until there is too much of it. The warehouse is full of goods - we pay taxes on the inventory, but it sells too slowly. Then we say – product turnover is low. But if it is very high, it means that the product is selling quickly, too quickly. Then the buyer, coming to us, runs the risk of not finding the right product. The answer is the ability to analyze and plan inventory turnover.
Concepts we operate with
Each manager uses terms such as “inventory”, “turnover”, “output”, “turnover”, “turnover ratio”, etc. However, when using economic and mathematical methods analysis there is often confusion in these concepts. As is known, exact sciences require precise definitions. Let's try to understand the terminology before we look at the concept of turnover in detail.
GOODS – products that are bought and sold; it is part of inventory. A product can also be a service if we demand money from our buyer for it (delivery, packaging, payment mobile communications by cards, etc.).
INVENTORY is a list of company assets (goods, services) available for sale. If you are in retail and wholesale trade, then your inventory includes not only the products sitting on the shelves, but also the products in stock, being shipped, stored or received—anything that can be sold.
If we are talking about INVENTORY, then these are considered to be goods in transit, goods in warehouse and goods in accounts receivable (since the ownership of it remains with you until it is paid by the buyer, and theoretically you can return it to to your warehouse for subsequent sale). BUT: to calculate turnover, goods in transit and goods in accounts receivable are not taken into account - only the goods present in our warehouse are important to us.
AVERAGE INVENTORY STOCK (TZav) is the value that we need for the actual analysis. TZav for the period is calculated according to formula 1.
Example
Calculation of the average inventory (TZav) for the year for a company selling, for example, small household chemicals and household goods, is given in table. 1.
The average TK for 12 months will be $51,066.
There is also a simplified formula for calculating average balances:
TZsr" = (balances at the beginning of the period + balances at the end of the period)/2.
In the above example, TZav" will be equal to (45,880 + 53,878)/2 = 49,879 dollars. However, when calculating turnover, it is still better to use the first formula (it is also called the average chronological moment series) - it is more accurate.
TABLE 1. Calculation of average inventory
TRADE TURNOVER (T) – the volume of sales of goods and provision of services in monetary terms for a certain period of time. Trade turnover is calculated in purchase prices or cost prices. For example, we say: “The store’s turnover in December was 40,000 rubles.” This means that in December we sold goods worth 39,000 rubles and also provided services for home delivery of goods to our customers for 1,000 rubles.
Turnover and turnover ratio
The financial success of a company, an indicator of its liquidity and solvency directly depends on how quickly funds invested in reserves are converted into hard cash.
As an indicator of inventory liquidity, the INVENTORY TURNOVER RATIO is used, which is most often simply called turnover.
This coefficient can be calculated according to different parameters (by cost, by quantity) and for different periods (month, year), for one product or for categories.
There are several types of inventory turnover:
- turnover of each product item in quantitative terms (by pieces, by volume, by weight, etc.);
- turnover of each item of goods by value;
- turnover of a set of items or the entire inventory in quantitative terms;
- turnover of a set of items or the entire inventory by value.
For us, two indicators will be relevant - turnover in days, as well as the number of product turnovers.
INVENTORY TURNOVER (IT) or INVENTORY TURNOVER RATE. The speed at which goods turn around (that is, they come to the warehouse and leave it) is an indicator that characterizes the effectiveness of the interaction between procurement and sales. There is also the term “TURNOVER”, which in this case is the same thing.
Turnover is calculated using the classic formula:
(Balance of goods at the beginning of the month)/(Turnover for the month)

But for increased accuracy and correct calculation, instead of the balance of goods at the beginning of the period, we will use the average inventory (ASV)
LET'S NOTE THREE IMPORTANT POINTS before we begin calculating turnover.
1. If the company does not have inventories, then there is no point in calculating turnover: for example, we sell services (run a beauty salon or provide consultations to the public) or make deliveries to the buyer from the supplier’s warehouse, bypassing our own warehouse (for example, an online bookstore).
2. If we unexpectedly implemented a large project and sold an unusually large batch of goods to the buyer’s order. For example, the company won a tender for the supply of finishing materials to a building being built nearby shopping mall and for this project I delivered a large batch of plumbing equipment to the warehouse. In this case, the goods supplied for this project should not be taken into account, since this was a targeted delivery of goods already sold in advance.
In both cases, the store or company makes a profit, but the inventory in the warehouse remains untouched.
In fact, we are only interested in LIVING STOCK - this is the quantity of goods that:
- came to the warehouse or was sold during the period under review (that is, any of its movements); if there was no movement (for example, elite cognac was not sold for a whole month), then it is necessary to enlarge the analysis period for this product;
- and also this is the quantity of goods for which there was no movement, but the goods were on balance (including those with a negative balance).
If goods in the warehouse were reset to zero, then these days must be deleted from the turnover analysis.
3. All calculations for turnover must be carried out in purchase prices. Trade turnover is calculated not at the selling price, but at the price of the purchased goods.
Formulas for calculating turnover
1. TURNOVER IN DAYS - the number of days required to sell existing inventory (see formula 2).
Sometimes it is also called the average shelf life of a product in days. This way you can find out how many days it takes to sell average inventory.
Example
The product item “Hand Cream” is analyzed, as an example in Table. 2 shows data on sales and inventories for six months.
Let's calculate the turnover in days (how many days it takes us to sell the average stock of goods). The average stock of cream is 328 pieces, the number of days on sale is 180, the sales volume for six months was 1,701 pieces.
Obdn = 328 pcs. (180 days / 1701 pieces = 34.71 days.
The average supply of cream turns over in 34–35 days.
TABLE 2. Sales and inventory data for the position "Hand Cream"

2. TURNOVER IN TIMES - how many turnovers a product makes during a period (see formula 3).
The higher the company's inventory turnover, the more efficient its activities are, the lower the need for working capital and the more stable the financial position of the enterprise, all other things being equal.
Example
Let's calculate the turnover in revolutions (how many times the stock is sold in six months) for the same cream.
1st option: Image = 180 days. / 34.71 = 5.19 times.
2nd option: Image = 1701 pcs. / 328 pcs. = 5.19 times.
Inventory turns over on average 5 times every six months.
3. PRODUCT INVENTORY LEVEL (STL) is an indicator that characterizes the store’s supply of inventory on a certain date, in other words, how many days of trading (given the current turnover) will this inventory last (see formula 4).
Example
How many days will our existing supply of cream last?
Utz = 243 pcs. (180 days / 1701 pieces = 25.71.
For 25–26 days.
You can calculate turnover not in pieces or other units, but in rubles or other currencies, that is, by cost. But the final data will still correlate with each other (the difference will only be due to rounding of numbers) - see table. 3.
TABLE 3. Final data for the calculation of Obdn, Obr, Utz

What does turnover give?
The main purpose of inventory turnover analysis is to identify those products for which the speed of the “product-money-product” cycle is minimal in order to make a decision about their future fate.
To illustrate, consider an example of analyzing the turnover ratio of two goods – bread and cognac, which are part of the assortment of a grocery store (see Tables 4 and 5).
TABLE 4. Analysis of the turnover ratio of two goods

From this table it can be seen that bread and expensive cognac have completely different indicators - the turnover of bread is several times higher than cognac. But it is unlawful to compare products from different product categories - such a comparison gives us nothing. Obviously, bread has one task in the store, and cognac has a completely different one, and perhaps the store earns more from one bottle of cognac than from bread sales in a week.
TABLE 5. Analysis of the turnover ratio of four products

Therefore, we will compare products within the category with each other - bread will be compared with other bread products (but not with cookies!), and cognac - with other elite alcoholic products (but not with beer!). Then we will be able to draw conclusions about the turnover of the product within the category and compare it with other products with similar properties.
By comparing products within a category, we can draw conclusions that tequila has a longer turnover period than the same cognac, and the turnover intensity is less, and that whiskey in the elite category alcoholic drinks have the highest turnover, and for vodka (despite the fact that its sales are twice as high as tequila) this figure is lower, which apparently requires adjusting the warehouse stock - perhaps vodka needs to be imported more often, but in smaller batches.
In addition, it is important to track the dynamics of changes in turnover in turnover (Obr) - compare with the previous period, with the same period last year: a decrease in turnover may indicate either a drop in demand, or an accumulation of poor quality goods or outdated samples.
Turnover in itself does not mean anything - you need to track the dynamics of changes in the coefficient (Turn), taking into account the following factors:
- the coefficient decreases - the warehouse is overstocked;
- the coefficient is growing or very high (shelf life is less than one day) - working “on wheels”, which is fraught with a lack of goods in the warehouse.
In conditions of constant shortage, the average amount of warehouse stock can be equal to zero - for example, if demand is growing all the time, but we do not have time to deliver goods and sell them “off the shelf”. In this case, there is no point in calculating the turnover ratio in days - perhaps it should be calculated in hours or, conversely, in weeks.
If a company is forced to store goods of irregular demand or highly seasonal goods in a warehouse, then achieving high turnover is not an easy task. To ensure customer satisfaction, we will be forced to stock a wide range of hard-to-find items, which will slow down overall inventory turnover. Therefore, the calculation of turnover for all inventories in the company is incorrect. It would be correct to count by category and by product within categories (product items).
Also, for a store, the terms of delivery of goods play an important role: if the purchase of goods is made using its own funds, then turnover is very important and indicative; if on credit, then you invest your own funds to a lesser extent or do not invest at all, then low turnover of goods is not critical - the main thing is that the loan repayment period does not exceed the turnover rate. If the goods are taken mainly on terms of sale, then first of all it is necessary to proceed from the volume of warehouse space, and turnover for such a store is the last most important indicator.
Turnover and attrition
It is important not to confuse the two concepts – turnover and attrition.
TURNOVER is the number of product turnovers during a period.
LEAVING RATE is an indicator that tells you how many days it takes for a product to leave the warehouse. If when calculating we do not operate with the average technical specifications, but calculate the turnover of one batch, then in reality we are talking about attrition rates.
Example
On March 1, a batch of 1000 pencils arrived at the warehouse. On March 31, there were no pencils left in stock (0). Sales are equal to 1000 units. It seems that the turnover is equal to 1, that is, this stock turns over once a month. But it is necessary to understand that in this case we are talking about one batch and the time of its implementation. One batch does not turn around in a month, it “goes away”.
If we calculate using the average stock, it turns out that on average there were 500 pieces in the warehouse per month.
1000/((1000 + 0)/2) = 2, that is, it turns out that the average inventory turnover (500 pcs.) will be equal to two periods. That is, if we brought two batches of pencils of 500 pieces each, then each batch would be sold in 15 days. In this case, it is incorrect to calculate turnover, because we're talking about about one batch and does not take into account the period when pencils were sold to zero balance - perhaps this happened in the middle of the month.
To calculate the inventory turnover ratio, batch accounting is not needed. There is an inflow of goods and an outflow of goods. Given a period (for example, 1 month), we can calculate the average inventory for the period and divide the sales volume by it.
Turnover rate
Very often you can hear the question: “What turnover rates exist? Which is correct?”
But companies always have the concept of “TURN OVER RATE” and each company has its own concept.
TURNOVER RATE is the number of days (or turnovers) for which, in the opinion of the company's management, the stock of goods must be sold in order for trade to be considered successful.
Each industry has its own standards. Some companies have different standards for different product groups. So, for example, our trading company used the following norms (turnovers per year):
- construction chemicals – 24;
- varnishes, paints – 12;
- plumbing – 12;
- facing panels – 10;
- rolled floor coverings – 8;
- ceramic tiles – 8.
In one of the chain supermarkets, the turnover rate for the non-food group is divided on the basis of ABC analysis: for goods A - 10 days, for goods of group B - 20 days, for C - 30. In this retail network, monthly turnover is included in the inventory indicator, and The inventory balance in the store consists of the turnover rate plus safety stock.
Also, some financial analysis specialists use Western standards.
Example
“Usually, merchants of industrial goods in Western enterprises have a turnover ratio of 6, if profitability is 20–30%,” writes E. Dobronravin in the article “Turnover ratio and level of service - indicators of inventory efficiency.” “If profitability is 15%, the number of turnover approximately 8. If the profitability is 40%, then a solid profit can be made from 3 turns in a year. However, as noted earlier, it does not follow that if 6 turns are good, then 8 or 10 turns are better. These data are indicative for planning general indicators".
Henry Assell in the book “Marketing: Principles and Strategy” writes: “In order for enterprises to operate profitably, their inventories must turn over 25–30 times a year.”
An interesting method for calculating the turnover rate is proposed by Dobronravin E. He uses a Western development that takes into account many variable factors: the frequency with which goods are ordered, transportation time, delivery reliability, minimum order sizes, the need to store certain volumes, etc.
What is the optimal amount of inventory turnover that can be included in the plan of a particular enterprise? Was analyzed by Charles Bodenstab a large number of companies using one of the SIC systems for inventory management. results empirical research were summarized in formula 5.
f in the proposed formula is a coefficient that generalizes the effect of other factors influencing the theoretical number of revolutions. These factors are:
- breadth of assortment in storage, that is, the need to store slow-moving stocks for marketing purposes;
- larger than required purchases in order to obtain volume discounts;
- requirements for a minimum purchase quantity from the supplier;
- supplier unreliability;
- economic order quantity (EOQ) policy factors;
- overstocking for promotional purposes;
- use of delivery in two or more stages.
Example
The store has factors (they are indicated in Table 6) applied for different suppliers.
You can give several examples of what the turnover rate will look like when the formula is applied (see Table 7).
TABLE 6. Store Factors for Suppliers

This means that if on average we import goods 3 twice a month (0.5) and transport them for 1 month, despite the fact that some factors (perhaps the supplier is unreliable) are not ideal, then the turnover rate can be considered 9.52. And for product 5, which we rarely import (it takes a long time, and the influencing factors are very far from ideal), it is better to set a turnover rate of 1.67 and not demand too much from its sale.
TABLE 7. Calculation of turnover rate

But the practice of Western companies is very different from Russian conditions - too much depends on logistics, purchase volumes and delivery times, supplier reliability, market growth and demand for goods. If all suppliers are local and turnover is high, then the coefficients can reach 30–40 turnovers per year. If supplies are intermittent, the supplier is unreliable and, as often happens, demand fluctuates, then for a similar product in a distant region of Russia the turnover will be 10–12 turns per year, and this is normal
Turnover rates will be higher for small enterprises working for the final consumer, and much lower for enterprises producing products of group A (means of production) - due to the length of the production cycle.
Again, there is a danger of roughly following the standards: for example, you do not fit into the turnover standard and begin to reduce your safety stock. As a result, there are failures in the warehouse, there is a shortage of goods and unsatisfied demand. Or you start to reduce the order size - as a result, the costs of ordering, transporting and processing goods increase. Turnover increases, but availability problems remain.
The norm is a general indicator, and you should react and take action as soon as some negative trend is detected: for example, inventory growth is outpacing sales growth, and at the same time as sales growth, inventory turnover has decreased.
Then you need to evaluate all the products within the category (perhaps some individual items are purchased in excess) and make informed decisions: look for new suppliers who can provide more short time deliveries, or stimulate sales for this type of product, or give it priority place in the hall, or train sellers to advise customers on this particular product, or replace it with another more well-known brand, etc.
The total capital turnover ratio is one of the indicators of the business activity of an enterprise. Reflects the turnover rate of all company funds. That is. how many times in the analyzed period does the full cycle occur (from the production of goods (services) to sales and receipt of profit.
This is an indicator of the efficiency of use of the company's assets. Since it shows how much money each unit of assets brings from sales.
Turnover analysis to determine business activity
Business activity reflects the performance of a company relative to the amount of invested funds or the amount of their consumption in the production process. The indicator is expressed in the dynamism of the enterprise’s development, the fulfillment of its assigned tasks, and the speed of turnover of funds.
Depends on turnover:
- annual turnover value;
- the amount of expenses (the higher the turnover rate, the less expenses there are for each turnover);
- speed of circulation at each stage (acceleration at one stage entails an increase in the speed of turnover at other stages).
The higher the turnover, the less the company needs to attract additional funds or the more products it can produce. As a result of accelerating the turnover of assets, working capital is released, and less materials, raw materials, and fuels and lubricants are required. Accordingly, the financial resources that the organization invested in these reserves are released.
Analysis of business activity involves the study of various coefficients. One of the main ones is the indicator of total capital (assets) turnover.
Total capital turnover ratio (resource productivity): formula
As a rule, a year is taken as the analyzed period. The ratio shows how many times the company’s assets “turn over”. The turnover rate - the speed at which funds are converted into money supply - directly affects the solvency of the organization.
Formula for the total capital turnover ratio:
revenue / average assets.
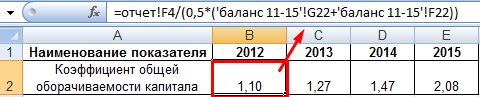
Total capital turnover ratio - balance sheet formula:
page 2110 / (0.5 * (page 1600np + page 1600kp)),
where line 2110 is from Form 2 (financial performance report), line 1600 is from Form 1 (balance sheet).
Let's calculate the efficiency of capital use using Excel. Data:
Indicator norm
Let's analyze the total capital turnover ratio. A standard value for the indicator has not been established. Most often, the obtained figures are compared with the corresponding values in the industry. For example, in capital-intensive areas, turnover will be lower than in trade.
The higher the ratio, the faster the capital “turns around”, the more more money the enterprise earns from every ruble of assets. For the analyst, the dynamics of the indicator over a number of periods are important.
The acceleration of capital turnover reflects:
- increasing production and technical potential;
- increase in profit (per each unit of asset);
- high efficiency of asset use.
The growth of the indicator may be artificial due to the use of leased fixed assets.
A decrease in the ratio indicates a decrease in sales volume or an increase in financial investments in the assets used.
Let's go back to the example and display it on a graph:
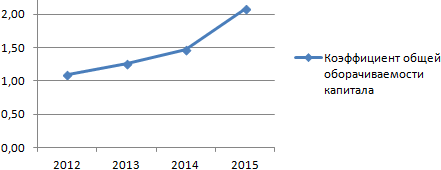
A stable increase in the capital turnover ratio indicates the efficiency of using the company's assets. The release of funds (due to accelerated turnover) allows the organization to improve its material and technical base, possibly launch a new product, or open a new sales direction.
To characterize the turnover of working capital, the following indicators are used:
- turnover ratio (K o), that is, the number of revolutions made by working capital during the period;
- utilization rate of funds in circulation (Кз);
- indicator of the duration of one revolution in days (T).
Turnover ratio calculated by the formula
where P is the volume of sales (by main types of activities) for the period at cost, rub.;
C – the average value of working capital for the period, which can be defined as the chronological average, rub.
Load factor of funds in circulation is defined as the inverse indicator:
Duration of one revolution (turnover period) in days is determined by the ratio of the number of days of the reporting period (D) to the turnover ratio:
Based on the above formulas for turnover of funds speed(K o) can be defined by two formulas:
Based on these two equations, we can obtain the equality
R/S = D/T
From this we derive a formula widely used in practice for determining the duration of turnover in days: .
Let's consider example. Cost price products sold per year is 20 million rubles. The average value of working capital for the year is 2 million rubles. In this case, the turnover ratio
T = (S∙D) / Ko
and the turnover period
T = D / Co = 365 / 100 = 36.5 days.
It follows that with the duration of one turnover being 36.5 days, working capital was turned over 10 times during the year. For every ruble of working capital there were 10 rubles. sold products. Obviously, the higher the turnover ratio, the better the use of working capital.
Working capital turnover indicators can be calculated similarly for all components of working capital involved in turnover and their individual elements. As a result of comparison of working capital turnover indicators, its acceleration or deceleration at the stages of their use is revealed. When the turnover of working capital accelerates, material resources and sources of their formation are released from circulation; when it slows down, additional funds are drawn into circulation.
The release of working capital due to the acceleration of their turnover can be absolute and relative. An absolute release occurs if the actual balances of working capital are less than the standard or balances of the previous period while maintaining or exceeding the sales volume for the period under review. Relative release of working capital occurs in cases where the acceleration of their turnover occurs simultaneously with an increase in production volume, and the growth rate of production volume is faster than the growth rate of working capital balances.
The main ways to reduce production inventories come down to their rational use, elimination of excess stocks of materials, improvement of rationing, improvement of supply organization, optimal selection of suppliers, and smooth operation of transport. An important role belongs to improving the organization of warehouse management.
Reducing the time spent by working capital in work in progress is achieved by improving the organization of production, improving the equipment and technology used, improving the use of fixed assets, and saving at all stages of the movement of working capital.
In the sphere of circulation, working capital does not participate in the creation of a new product, but only ensures its delivery to the consumer. The most important prerequisites for reducing investments of working capital in the circulation sector is the rational organization of sales finished products, the use of progressive payment methods, timely execution of documentation and acceleration of its movement, compliance with contractual and payment discipline.
Structure of working capital at enterprises different industries industry is determined by the specifics of their production and the nature of the products produced. For example, in ferrous metallurgy, the size and structure of working capital are determined by the continuous production process and the significant material intensity of products.
Along with the division of working capital by stages of circulation into working capital (functioning in the sphere of production) and circulating funds (functioning in the sphere of circulation), there is a second division into standardized and non-standardized working capital. Standardized working capital consists of working capital and finished products in the warehouse, ensuring the continuity of the production process. In the total amount of working capital of ferrous metallurgy enterprises, the predominant part (up to 90%) is made up of standardized working capital. The division of working capital into standardized and non-standardized is not rigid. The organization has the right to independently determine the list of working capital included in a particular group.
The success of any enterprise directly depends on how rationally working capital is spent. It is very important to pay close attention to the economic side of the revolving fund.
Conducting such research is not at all difficult and it will help determine whether there are problems at the enterprise and solve them, thereby preventing losses.
plays a very important role turnover ratio. It can be used to characterize how efficient the turnover of assets is.
The necessary data for calculating this ratio is taken from the accounting balance sheet.
The concept of working capital turnover ratio is the ratio of the amount that was received from the sale of products.
Working capital is a certain amount of money that is invested in order to create production assets turnover. All this allows the company or company to work without interruptions.
Where to get indicators for calculation
Of course, it must be remembered that all this data must be used for the period for which the calculation is being made. Usually, all indicators are calculated for the year, so all the necessary information is taken from the annual accounting report.
The volume of all products already sold is indicated in the RP formula. This volume is located in line 10 of the loss and profit report. It is in this answer that you can clearly see all net revenue from total sales for a certain period.
It is important to subtract the average cost of all assets. To do this, it is necessary to divide all amounts of working value from the beginning to the end of the required period.
The necessary data in order to make the calculation is taken from the balance sheet, exactly from line 290. It is there that the totals of all current assets are indicated.
What do the coefficients depend on?
Each industry has its own indicator. The indicator is highest in the trade industries. Other from industries, such as cultural or scientific organizations don't have high level coefficient Therefore, it is impossible to compare all enterprises, because they differ in their type of activity.
The coefficient depends on the following factors:
- Type of raw materials used in the industry;
- Volume and pace of production;
- Cycle duration;
- Qualifications of all employees of the enterprise;
- Type of activity of the enterprise;
Ratio calculations
The coefficient allows you to find out what the volume of revenue is from the sale of all goods or products and how much of this is accounted for per ruble of the working capital. This calculation uses the formula
Cob = RP/SO
Here the turnover ratio is defined as Cob.
RP is the volume of all products that were sold during the period for which the report is being carried out.
CO – denotes the average cost of turnover for the required period.
Analysis of current assets ratio
When the asset ratio is greater than 1, this indicates that the company is generating income. If the coefficient exceeds 1.36, such an enterprise is extremely profitable and brings very good profits.
It is also important to monitor changes in the coefficient over time. Everything looks more clearly in the tables, from which you can monitor all changes and draw appropriate conclusions.
Possible reasons for a decrease in the turnover ratio
If the dynamics of the coefficient falls, this is an alarming sign, and the company’s management should seriously think about how to increase it and what needs to be done for this.
Often the reason for a low indicator is excessive accumulation of material assets. In this case, you need to reduce the volume of goods, and invest all the saved money in production.
An important point is the introduction of new equipment and technologies, the desire to improve all production and operation of the enterprise.
The reasons for the low ratio could be anything. For example, It is very important to monitor the qualifications of employees and their level of productivity, monitoring the condition of the equipment so that breakdowns and production stagnation do not occur.
Calculation of the working capital ratio
It is impossible to imagine the effective and fruitful operation of an enterprise without the correct use of working capital.
Working capital always varies depending on the time of year, the standard of living and activity. If resources are used wisely, then the activities of the enterprise will be successful and fruitful.
How competently and correctly capital is used can be determined using ratios. Some of them help to analyze the liquidity and speed of the organization. The turnover ratio is very important. He designates it as Kob.
Indicators required for calculation
The turnover ratio is determined using the data that is in the financial report of the enterprise, namely in the first two lines of the accounting report.
The volume must be calculated as revenue for a certain period, which is taken from the financial results statement.
You need numbers that are written in the line of the report where the amount that was received from all sales or sales of services and goods is indicated.
The average residual is subtracted from the amount located in the second column of the accounting balance using the formula:
Ф ob.sr = Ф1+Ф0/2
F0 and F1 are two values of the enterprise’s turnover for the present and past periods.
Formula and calculation
The turnover ratio indicates the number of turnovers of working capital over a certain period of time. It can be calculated using the following formula:
Cob = Qp/Fob.avg.
That is, it turns out in such a way that all the money that the organization invests in the development of its business is returned back after a certain time and in the form of a finished product, which is then sold and brings monetary profit.
In addition to the coefficient indicating turnover in economic analysis, there are other designations:
- Duration of one revolution Tob;
- Profitability Rob.sr;
Turnover ratio analysis
Before analyzing the turnover ratio, it is necessary to understand what the working capital of an enterprise is. This is the value of assets whose useful life is less than a year.
These include:
- Production in progress;
- Already finished product and goods;
- Stock;
- Material resources;
- Accounts receivable;
Inventories can be reduced if all resources are used more economically and if production losses increase.
Reasons for the decline in turnover ratio
A decrease in the coefficient can occur for several reasons, based on internal and external factors.
Let’s say that the economy in the country has worsened and people have begun to buy less of a certain product, or when new models of equipment appear, the older ones will no longer be sold. This is an external reason.
Internal reasons:
- Mismanagement of funds;
- Erroneous actions in logistics and marketing;
- Debts of the organization;
- Application of old technologies in production;
The conclusion suggests that all these reasons appear due to mistakes within the company and insufficient qualifications of workers.
If the company has moved to a new, more modernized level and new methods, the coefficient may also decrease.
Calculations using example
For example, there is an organization called Omega. Having done an analysis for 2012, the result showed that the income that year was 100,000 rubles. and the amount of all working capital is 35,000 rubles. and in 2013 45,000 rubles.
Let's look at the formula:
Kob = 100,000r/(35+45/2)=2.5
Using the result of this formula, we calculate the annual turnover cycle of the enterprise:
Tob = 360/2.5=144 days
It turns out that the production cycle of the Omega organization is 144 days.
Turnover of current assets
Definition
Using the current assets indicator, you can find out how many times over a certain period the organization used the average balance of all available funds.
In accordance with the accounting balance current assets This:
- Stocks;
- Material resources;
- Short-term debt to debtors of purchased goods, including VAT.
Formula (calculation)
Current assets are calculated using a special formula:
Assets turnover = Revenue/turnover assets
For the formula, current assets must be taken as the average annual balance.

Normal value
Turnover indicators do not have any general norms. They are analyzed over time or in comparison with similar industry enterprises. A very low coefficient indicates that a very large accumulation of inventories in the enterprise.
Asset turnover ratio using the example of OJSC Rostelecom
The asset turnover ratio is part of the group of business activity indicators and shows How intensively the organization's resources were used.
The economic meaning of the asset turnover ratio
The asset turnover ratio helps determine how effective the organization is not in terms of profit, but from the use of assets in production.
What is a component of current assets?
Working capital is:
- Any stocks;
- Material resources, namely cash;
- Investments for short periods;
- Short-term accounts receivable;
On what factors does the value of the asset turnover ratio depend?
The asset turnover ratio depends on several factors:
- Duration of production;
- Qualification level of the organization's personnel;
- Organization's activities;
- Production rates;
The largest coefficient is in enterprises where they engage in trade. Its level is lowest in scientific enterprises. Therefore, it is necessary to compare organizations within their industry.
Synonyms for asset turnover ratio
Such a value as asset turnover ratio has synonyms.
The turnover ratio can be operating capital or mobile funds.
It is useful to know the synonyms of the coefficient, since there are various literary sources, and everywhere the coefficient is called differently.
But due to the fact that many economists call the coefficients in their own way, one thing is missing specific definition and the coefficient term.
Asset turnover ratio standard
The coefficient is never negative. Its low level indicates that the company has accumulated an excessive amount of working capital.
For the coefficient to become higher, you need to sell what people need and at the same time the product must be high quality and affordable. This increases competitiveness. At the same time, the product production cycle should be lower.
Analysis of the coefficient using dynamics will allow you to determine its level and find out whether the organization’s economy is moving well.
Noskova Elena
I have been in the accounting profession for 15 years. She worked as a chief accountant in a group of companies. I have experience in passing inspections and obtaining loans. Familiar with the fields of production, trade, services, construction.